Cost of Corrosion in 2026 – US and Globally
2026 – UPDATED COST OF CORROSION REPORT
The Annual Cost of Corrosion in the United States
Over $2 Trillion!
Corrosion now costs the U.S. economy more than $2 trillion per year, making it one of the single largest expenditures in the nation. Updated analysis from US Corrosion Services based on the landmark NACE IMPACT study and estimated 2026 GDP data.
From $276 Billion to $2 Trillion
The most widely cited figure for the cost of corrosion in the United States remains the $276 billion estimate from the 1998 NACE Corrosion Costs Study. That number represented only the direct costs of corrosion, and it was calculated at a time when the U.S. GDP was $8.79 trillion. At 3.1% of GDP, the direct cost alone was already staggering. But the study itself noted that indirect costs were conservatively at least as large as the direct costs, pushing the true total to 6.2% of GDP or higher.
What has happened in the intervening 27 years is straightforward math, but the result is arresting. The U.S. nominal GDP reached approximately $30.6 trillion in 2025 and is estimated at $32.4 trillion for 2026. Applying the same 3.1% ratio yields a direct cost of approximately $1,002 billion, and including indirect costs at the same ratio brings the total to over $2 trillion per year.
To put that in perspective, $2 trillion is more than double the entire U.S. defense budget, larger than the GDP of all but about ten countries in the world, and roughly equivalent to the combined economic output of Switzerland and Sweden. It dwarfs the annual spending on education and is exceeded among domestic expenditures only by healthcare and Social Security.
Estimated U.S. Corrosion Costs Over Time
Total (direct + indirect) corrosion costs in billions of dollars, assuming constant 6.2% of GDP ratio
Corrosion in the Context of Other Major Expenditures
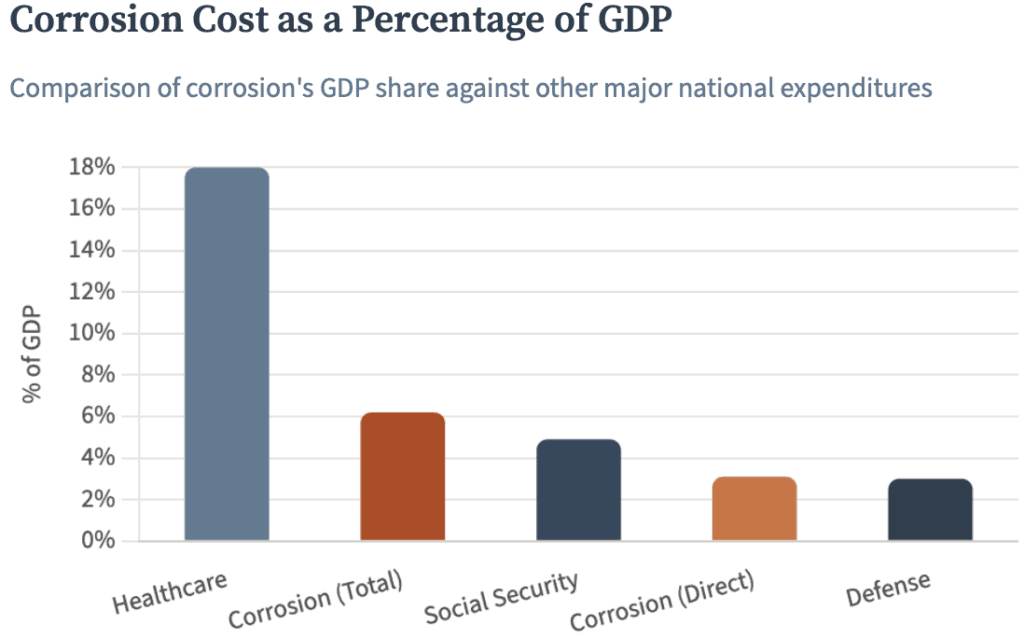
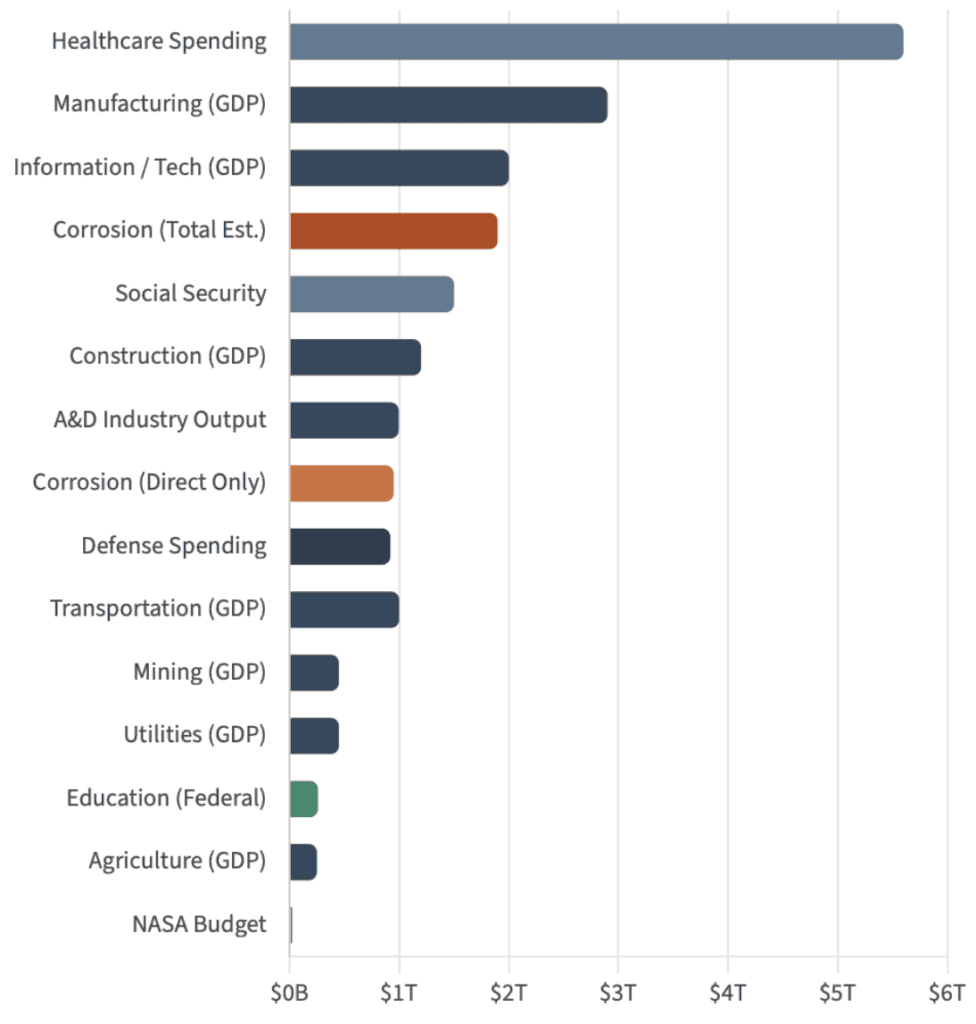
The scale of corrosion costs becomes more tangible when compared against other familiar line items in the U.S. economy. Healthcare, at $5.6 trillion projected for 2025, is in a class by itself at roughly 18% of GDP. But after healthcare, the estimated total cost of corrosion at $1.9 trillion is comparable in scale to Social Security ($1.5 trillion), and substantially exceeds defense spending ($919 billion) and federal education outlays ($260 billion).
Corrosion vs. Other Major U.S. Expenditures (2025)
Annual spending in trillions of dollars. Corrosion costs include both direct and indirect estimates.
What makes the corrosion number particularly remarkable is that, unlike healthcare and defense, there is no single agency, no cabinet department, and no consolidated budget line item tracking it. Corrosion costs are distributed across every industry sector, borne by equipment operators, asset owners, taxpayers, consumers, and insurance pools. They are largely invisible in aggregate, which is precisely why they tend to receive less policy attention than their scale warrants.
What the Numbers Include
Direct Costs
The direct costs of corrosion are those attributable to the owner or operator of the corroding equipment or infrastructure. These span two broad categories: costs incurred during design, manufacturing, and construction, and costs associated with ongoing corrosion management during the operational life of assets.
Design and construction costs include the selection of corrosion-resistant alloys (often at a premium over carbon steel), the addition of corrosion allowance in wall thickness, the application of protective coatings, paints, sealants, and inhibitors, cathodic protection system installation, and the associated labor and equipment. Management-related costs encompass corrosion-driven inspection programs, maintenance, repair and replacement of corroded components, inventory of backup parts, rehabilitation and refurbishment campaigns, and the loss of productive time during corrosion-related shutdowns.
Indirect Costs
The indirect costs are all those borne by parties other than the owner or operator: the community, the public, and society at large. These are inherently harder to quantify, which is one reason they are often overlooked in discussions that focus exclusively on the $276 billion (now $949 billion) direct figure. Indirect costs include the economic consequences of service outages (lost electrical generation, disrupted transportation), environmental cleanup from corrosion-related releases, health impacts, litigation, and the cascading effects on supply chains when critical equipment fails unexpectedly.
The 1998 NACE study conservatively estimated indirect costs to be at least equal to direct costs. Some analysts have argued the ratio could be higher, particularly in sectors like water and wastewater infrastructure, where the societal consequences of a single pipeline failure can propagate far beyond the direct repair cost.
Breakdown of Direct Corrosion Costs by Sector
Based on NACE study sector allocations, scaled to 2025 GDP. Values in billions of dollars.
Why the Percentage May Be Conservative
There are arguments in both directions about whether the 6.2% ratio has changed since 1998. On one hand, improved inspection technologies (phased-array UT, guided wave, inline inspection tools), better coatings, and more widespread cathodic protection programs have reduced some corrosion-related failures. On the other hand, the U.S. infrastructure base continues to age, and a growing fraction of pipelines, bridges, storage tanks, and industrial equipment is now operating well past its originally designed service life.
15-35%
According to the NACE/AMPP IMPACT study, implementing available corrosion control best practices could save between 15% and 35% of total corrosion costs. At 2025 figures, that translates to potential annual savings between $285 billion and $665 billion.
The American Society of Civil Engineers has consistently given U.S. infrastructure grades in the C and D range. The average age of the 617,000 bridges in the national inventory continues to climb, water main breaks occur at a rate of roughly 250,000 per year, and much of the nation’s pipeline network is approaching or exceeding its original 50-year design horizon. These trends suggest that the 3.1% direct cost ratio may in fact be understated relative to 1998, even as some individual industries have made progress.
A Comparison Across Decades
| YEAR | U.S. GDP | DIRECT COST (3.1%) | TOTAL EST. (6.2%) |
|---|---|---|---|
| 1998 | $8.79 T | $276 B | $545 B |
| 2005 | $13.0 T | $403 B | $806 B |
| 2010 | $15.0 T | $465 B | $930 B |
| 2013 | $16.8 T | $521 B | $1,042 B |
| 2016 | $18.7 T | $580 B | $1,159 B |
| 2020 | $21.4 T | $663 B | $1,326 B |
| 2025 | $31.4 T | $973 B | $1,946 B |
| 2026 | $32.3 T | $1,001 B | $2,002 B |
Methodology: These estimates apply the 3.1% direct cost ratio from the original 1998 NACE Corrosion Costs Study to nominal U.S. GDP in each year. The indirect cost estimate follows the study’s conservative assumption that indirect costs are at least equal to direct costs. GDP figures are from the U.S. Bureau of Economic Analysis and IMF. While the actual ratio has almost certainly changed since 1998 (in ways that are difficult to measure precisely without a new comprehensive study), this approach provides a reasonable and widely accepted basis for estimation.
The Global Picture
The NACE International IMPACT study, released in 2016, estimated the global cost of corrosion at $2.5 trillion per year, equivalent to about 3.4% of global GDP. That figure used 2013 data. With global GDP in 2025 exceeding $117 trillion, a similar ratio would place current direct global corrosion costs well above $3 trillion annually, and total costs over $6.5 trillion. The study found that the percentage varies by economic structure: heavily industrialized nations tend to spend more on corrosion as a fraction of GDP than service-dominated economies, and countries with aging infrastructure bear disproportionate costs.
Corrosion Cost as a Percentage of GDP
The comparison of corrosion’s GDP share against other major national expenditure really shocked me: a few examples are shown below. At 1/3 of healthcare costs, the total cost of corrosion is more than social security or defense (in 2025 at least).
Corrosion vs. Major U.S. Expenditures and Industry Sectors (2025)
Annual spending or GDP value-added in billions of dollars. Corrosion costs include both direct and indirect estimates. Industry values represent BEA value-added to GDP.
What This Means for Industry
The practical implication of these numbers is that corrosion management is not a small concern. It is a core cost driver for any asset-intensive industry, from refining and petrochemicals to power generation, transportation, water treatment, and construction. Companies that invest in appropriate materials selection, protective coatings, cathodic protection, and inspection programs are not spending “extra” money; they are optimizing a line item that constitutes a significant fraction of their total operating cost. In cases when profit margins or small, this can be the difference between profit and loss!
At US Corrosion Services, we work with operators and owners across these sectors to characterize corrosion mechanisms, evaluate material performance, conduct failure analyses, and develop corrosion management strategies that reduce both direct and indirect costs. Our laboratory capabilities include accelerated corrosion testing (salt fog, immersion, electrochemical methods), hydrogen embrittlement evaluation, metallographic examination, SEM/EDS analysis, and coating characterization. We also provide expert witness and litigation support services for corrosion-related disputes.
The cost of corrosion is not going away. But a substantial portion of direct costs, somewhere between $285 billion and $665 billion per year in the U.S. alone, is preventable with existing technology and best practices. The organizations that invest in understanding and managing corrosion systematically are the ones that avoid the catastrophic failures and unplanned shutdowns that drive the numbers in this report.
Want to Cite Our Analysis?
This analysis is provided as a public resource by US Corrosion Services. Journalists, researchers, educators, and industry professionals are welcome to reference the data and figures presented here, provided that proper attribution is given. If you are writing an article, report, presentation, or other publication that references this analysis, please use the following citation and include a link back to this page.
Suggested citation: Jackson, J.E. "Cost of Corrosion Annually in the United States." US Corrosion Services, April 2025. https://uscorrosion.com/cost-of-corrosion/
Reproduction of the charts, data tables, or substantial portions of the text for commercial purposes requires written permission from US Corrosion Services. For media inquiries, interview requests, or permission to reproduce figures, please contact Dr. Joshua Jackson at info@uscorrosion.com or 832-481-6600. We are happy to provide additional context, updated figures, or expert commentary for your coverage.
Sources and references:
NACE International, “Corrosion Costs and Preventive Strategies in the United States,” FHWA-RD-01-156 (2002), original study data from 1998.
NACE International, “International Measures of Prevention, Application, and Economics of Corrosion Technologies (IMPACT),” 2016.
U.S. Bureau of Economic Analysis GDP data.
IMF World Economic Outlook, October 2025 edition.
CMS National Health Expenditure data.
USAFacts defense spending analysis.
All corrosion cost projections are estimates by US Corrosion Services based on the methodology described above.
Ready to Reduce Your Corrosion Costs?
Our team of PhD metallurgists and corrosion engineers helps you identify, characterize, and manage corrosion before it becomes a failure: